Arguments about preparation technique are usually settled by preference, habit or marketing. The slide behind this article settles them with four measurable dimensions instead, placed side by side: tooth reduction, anesthesia and temporaries, primary complications, and long-term survival rate. It is the most direct evidence in the 2026 Digital Smile Roadmap, and it is worth reading closely rather than skimming. If you have been weighing up cosmetic dental treatment for a home around Sioux Falls, SD, this guide covers how it actually works, what it tends to cost, and where the results usually fall short.
The comparison, as published in the roadmap
The deck presents two columns — conventional and biomimetic no-prep — scored across the same four dimensions. No dimension is measured with a different yardstick for each column, which is what makes the table useful.
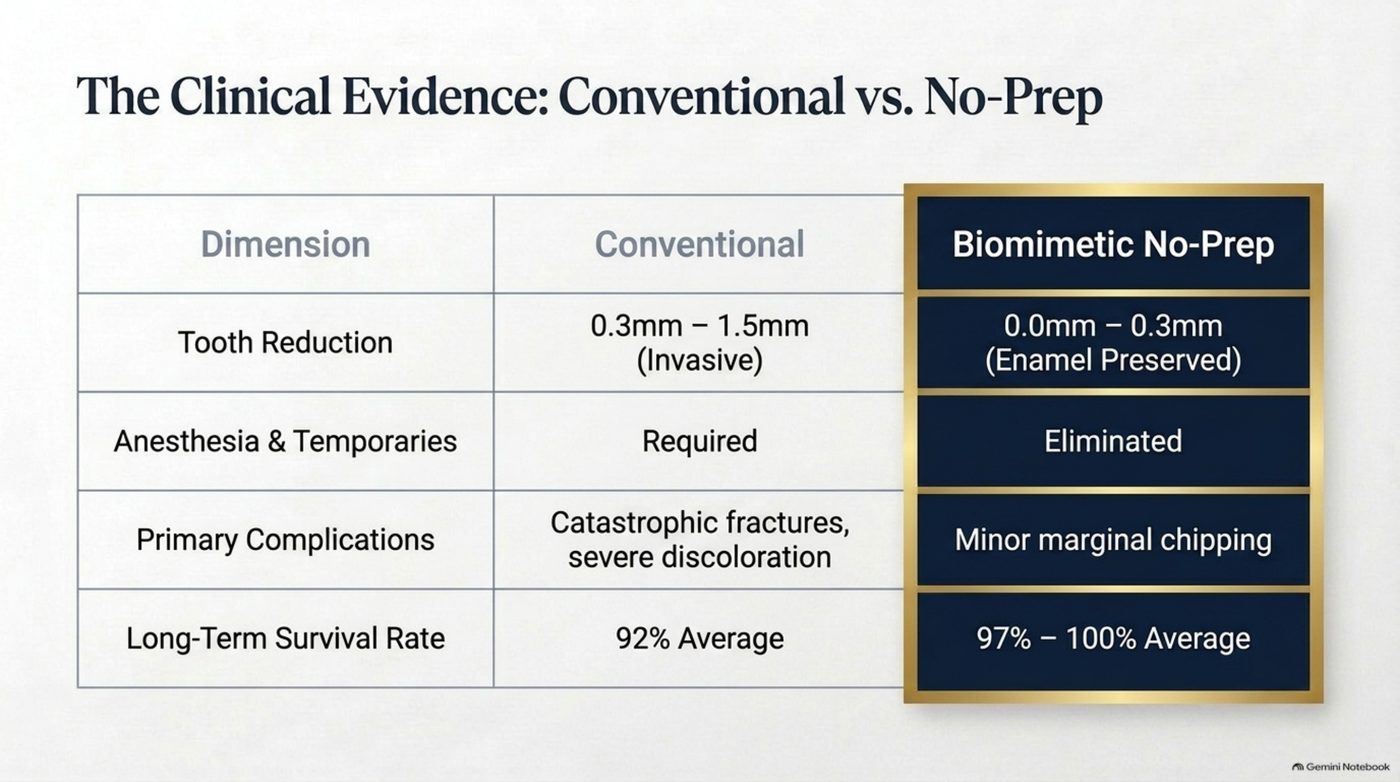
| Dimension | Conventional | Biomimetic no-prep |
|---|---|---|
| Tooth reduction | 0.3mm – 1.5mm (invasive) | 0.0mm – 0.3mm (enamel preserved) |
| Anesthesia and temporaries | Required | Eliminated |
| Primary complications | Catastrophic fractures, severe discoloration | Minor marginal chipping |
| Long-term survival rate | 92% average | 97% – 100% average |
Tooth reduction: 0.3–1.5mm versus 0.0–0.3mm
The numbers in the first row describe two different relationships with your own anatomy. Conventional preparation removes between 0.3mm and 1.5mm of tooth structure, and the deck labels this invasive without hedging. The biomimetic no-prep column removes between 0.0mm and 0.3mm. The relevant fact is not the arithmetic difference. It is that the lower figure is measured in tenths of a millimeter and can reach zero. Enamel removed is enamel that does not come back, and the size of the reduction is the size of the permanent trade.
Anesthesia and temporaries: required versus eliminated
The second row is the one patients feel immediately. When preparation is avoided, the injection that accompanies it and the temporary restoration that covers the prepared tooth are both eliminated, not merely reduced. That removes an entire phase of treatment: no period spent wearing a stand-in, no risk of a temporary coming loose, no second appointment dedicated to replacing one.
Primary complications: the difference in failure mode
The third row explains why the survival figures in the fourth row diverge. Conventional preparation is associated with catastrophic fractures and severe discoloration as its primary complications. The biomimetic no-prep column lists minor marginal chipping. The distinction is not severity for its own sake; it is failure mode. A minor chip at a margin is a repair. A catastrophic fracture can mean the loss of the restoration and, in the worst case, of the tooth itself. Discoloration, similarly, is a change that happens underneath and is not reversible.
Long-term survival: 92% versus 97–100%
The fourth row puts an average of 92% against a range of 97% to 100%. Two things are worth noticing. First, the conventional figure is a single average while the no-prep figure is a range reaching the top of its band. Second, the direction of the difference is consistent with the complication row: the technique that fractures less and discolours less is also the technique with the higher survival rate. The four rows are not independent statistics; they describe one mechanism from four angles.
Before you compare quotes, put the numbers into context with the veneer cost calculator and the smile makeover cost guide on the tools hub, and use the knowledge quiz to test what you think you know. To talk through which column your own case falls into, call (605) 601-8245.
How to read a survival range honestly
A survival rate is not a promise, and the roadmap presents the two columns in a form that respects that. The conventional figure is given as a 92% average. The no-prep figure is given as a 97% to 100% average range. Neither is a statement about your specific tooth, and neither should be read as one. What a comparison of this kind establishes is a direction and a mechanism. The technique that removes less tooth structure and fails with minor chipping rather than catastrophic fracture is the technique whose restorations are still present years later. The rows of the table are consistent with each other, and that internal consistency is what makes the evidence worth acting on.
Applying the evidence to your own case
Evidence tells you which technique to prefer. It does not tell you which technique your teeth require, and that distinction is where clinical judgement enters. Some cases need preparation to correct position or shape; a rotated tooth cannot always be resolved by bonding to the surface it presents. The useful approach is to treat the no-prep column as the default and the conventional column as the fallback that has to be justified, rather than the other way around. Ask what specifically requires reduction, and in what units, before accepting that reduction is necessary.
Why the complication row is the most important one
Patients tend to fix on the survival percentages, and the third row is more informative. Survival tells you whether a restoration was still present; complications tell you what went wrong when it was not. Catastrophic fractures and severe discoloration are outcomes that can end the useful life of a tooth, not merely of a restoration. Minor marginal chipping is an outcome that can be repaired. Between two techniques with similar headline reliability, the one that fails smaller is the one to choose.
What the table does not tell you
Four dimensions are not the whole picture, and the roadmap does not pretend otherwise. The table does not tell you how a specific tooth was positioned to begin with, what condition its enamel is in, or what load the bite will place on the restoration. Those are clinical inputs that decide whether a no-prep approach is appropriate for a particular case. What the table does is remove the assumption that removing more tooth structure buys durability. That assumption is the basis on which most preparation decisions are defended, and on this evidence it does not hold.
Frequently Asked Questions
Does a 97–100% survival rate mean no-prep restorations never fail?
No. It is an average survival range across the cases studied, not a promise for an individual tooth. What it shows is that enamel preservation does not cost durability; on this evidence it supports it.
Why does the conventional column list worse complications?
Because removing more tooth structure changes what happens when a restoration is stressed. That is why the complications are catastrophic fractures and severe discoloration rather than minor chipping.
Is no-prep always the right choice?
Not always. Some cases genuinely require preparation to correct position, shape or bite. The evidence argues for choosing the least invasive option that meets the case rather than defaulting to reduction.